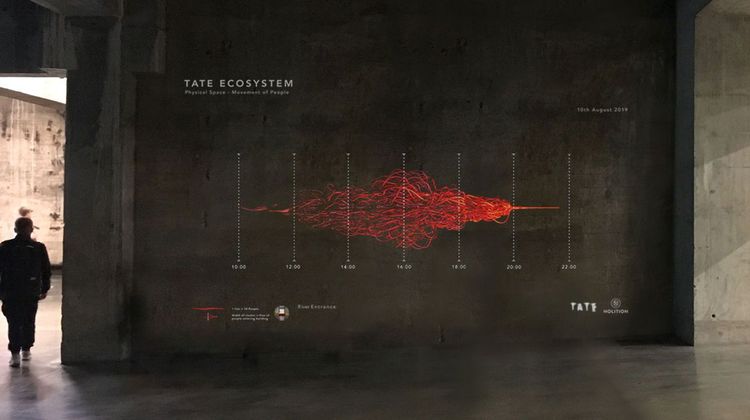
A multidisciplinary collaboration between the Tate and Holition, The Tate Ecosystem presents a microcosm of life at the Tate, both online and in the galleries.
The data visualisation focuses on the physical space of the Tate. Similar to the beautiful flow and movement of natural ecosystems, data was sourced to measure the movement of people within its six entry points. Each strand of the visualisation represented 10 people while the width of each cluster represented the flux of people entering the building over time.